
Introduction to Splunk
Typically when people think of a SIEM Security Information and Event Management system that is used to aggregate security information in the form of logs, alerts, artifacts and events into a centralized platform that would allow security analysts to perform near real-time analysis during security monitoring.
they think of Splunk, and rightly so. Per the Splunk website, they boast that 91 of the Fortune 100 use Splunk.
Splunk is not only used for security; it's used for data analysis, DevOps, etc. But before speaking more on Splunk, what is a SIEM exactly?
A SIEM (Security Information and Event Management) is a software solution that provides a central location to collect log data from multiple sources within your environment. This data is aggregated and normalized, which can then be queried by an analyst. As stated by Varonis, there are 3 critical capabilities for a SIEM:
Threat detection
Investigation
Time to respond
Some other SIEM features:
Basic security monitoring
Advanced threat detection
Forensics & incident response
Log collection
Normalization
Notifications and alerts
Security incident detection
Threat response workflow
This room is a general overview of Splunk and its core features. Having experience with Splunk will help your resume stick out from the rest.
Splunk was named a "Leader" in Gartner's 2020 Magic Quadrant for Security Information and Event Management.
Per Gartner, "Thousands of organizations around the world use Splunk as their SIEM for security monitoring, advanced threat detection, incident investigation and forensics, incident response, SOC automation and a wide range of security analytics and operations use cases."
Room Machine
Before moving forward, deploy the machine. If you want to RDP into the machine yourself:
Machine IP: 10.10.205.242
User name: administrator
User password: letmein123!
Open Chrome and navigate to the Splunk instance (http://127.0.0.1:8000). You may need to refresh the page until Splunk loads.
Note: Splunk can take up to five minutes to fully load.
If you want to install Splunk on your own machine, follow Splunk's official installation notes [here](Per Gartner, "Thousands of organizations around the world use Splunk as their SIEM for security monitoring, advanced threat detection, incident investigation and forensics, incident response, SOC automation and a wide range of security analytics and operations use cases."
Room Machine
Before moving forward, deploy the machine. If you want to RDP into the machine yourself:
Machine IP: 10.10.205.242
User name: administrator
User password: letmein123!
Open Chrome and navigate to the Splunk instance (http://127.0.0.1:8000). You may need to refresh the page until Splunk loads.
Note: Splunk can take up to five minutes to fully load.
If you want to install Splunk on your own machine, follow Splunk's official installation notes here.
Virtual machine deployed. No answer needed
Navigating Splunk
When you access Splunk, you will see the default home screen identical to the screenshot below.
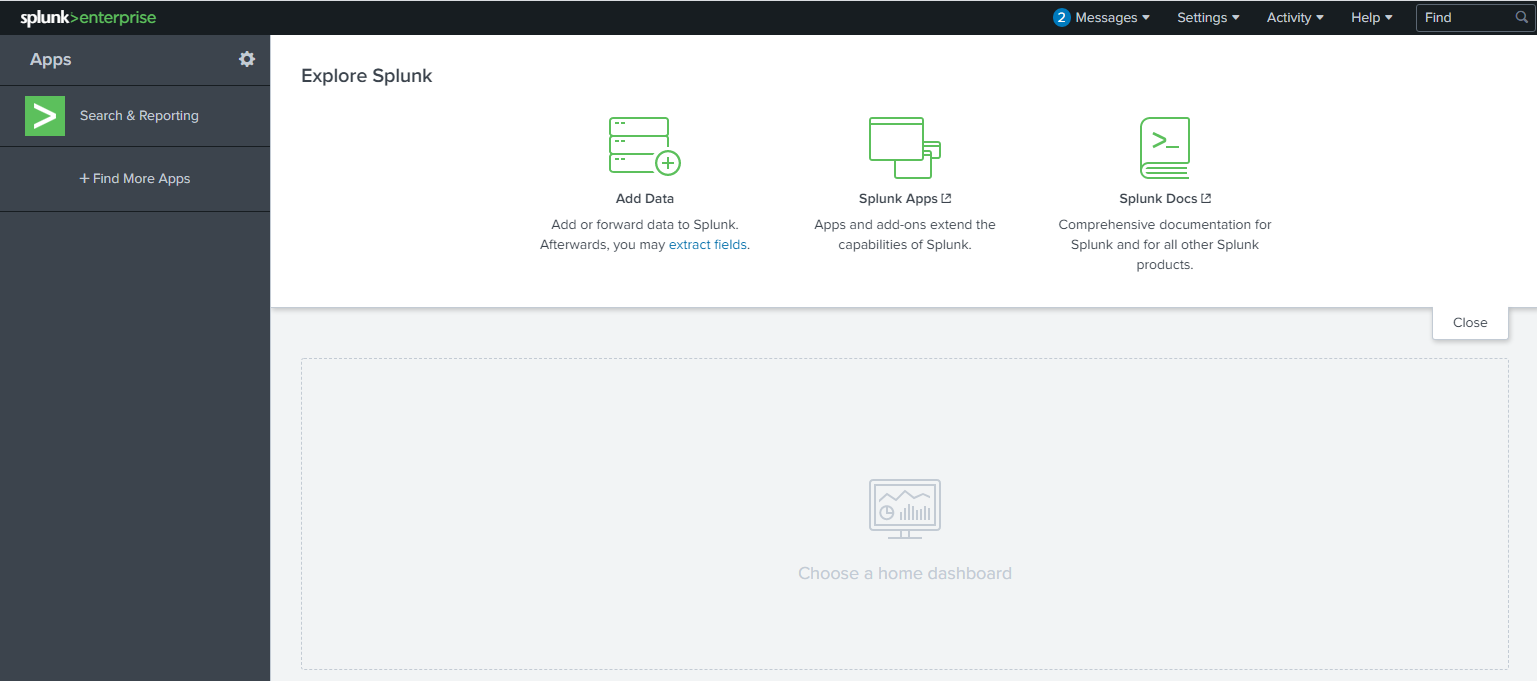
Let's look at each section, or panel, that makes up the home screen. The top panel is the Splunk Bar (below image).

In the Splunk Bar, you can see system-level messages (Messages), configure the Splunk instance (Settings), review the progress of jobs (Activity), miscellaneous information such as tutorials (Help), and a search feature (Find).
The ability to switch between installed Splunk apps instead of using the Apps panel can be achieved from the Splunk Bar, like in the image below.

Next is the Apps Panel. In this panel, you can see the apps installed for the Splunk instance.
The default app for every Splunk installation is Search & Reporting.

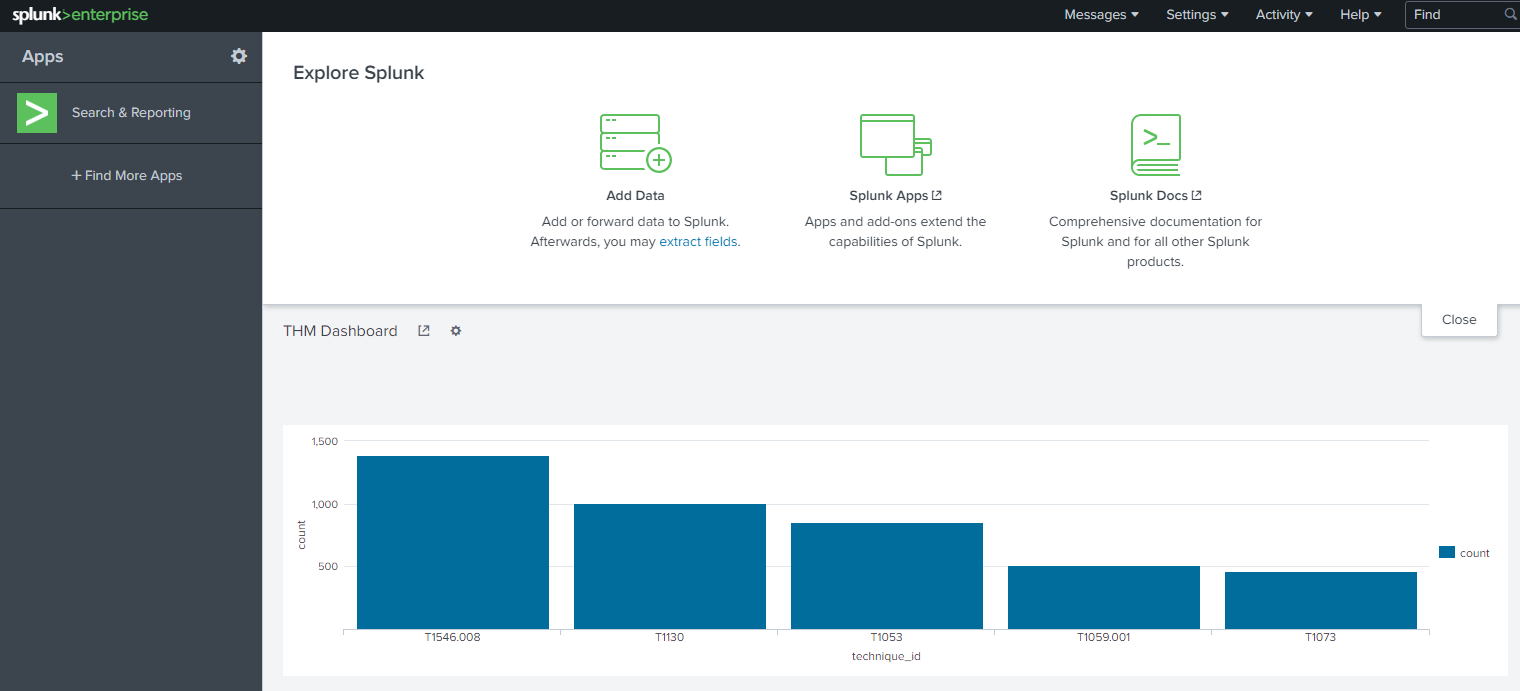
The next section is Explore Splunk. This panel contains quick links to add data to the Splunk instance, add new Splunk apps, and access the Splunk documentation.

The last section is the Home Dashboard. By default, no dashboards are displayed. You can choose from a range of dashboards readily available within your Splunk instance. You can select a dashboard from the dropdown menu or by visiting the dashboards listing page.

You can also create dashboards and add them to the Home Dashboard. The dashboards you create can be viewed isolated from the other dashboards by clicking on the Yours tab.
Please review the Splunk documentation on Navigating Splunk here.
In the next section, we'll look at Splunk Apps a bit further.
I'm ready to look at Splunk apps. No answer needed
Splunk Apps
As mentioned in the previous task, Search & Reporting is a Splunk app installed by default with your Splunk instance. This app is also referred to as the Search app. If you click on the Search & Reporting app, you will be redirected to the Search app (see image below).
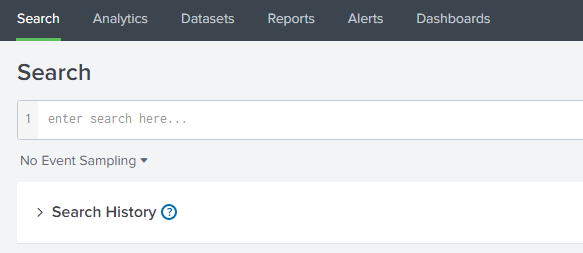 The Search app is where you will enter your Splunk queries to search through the data ingested by Splunk. More on Splunk queries later.

The above image is the navigation for the Search app. Each app will have its own navigation menu. This menu is different from the menu/navigation within the Splunk bar, accessible throughout your entire Splunk session.
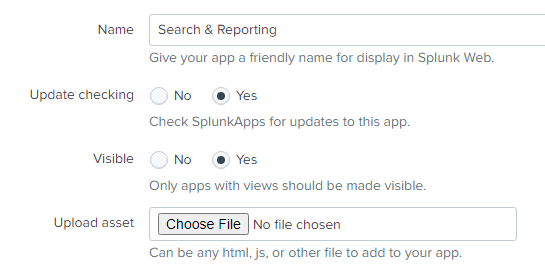
Let's draw our attention back to the Splunk Home page. In the Apps panel, there is a cog icon. By clicking the cog, you will be redirected to the Manage Apps page. From this page, you can change various settings (properties) for the installed apps. Let's look at the properties for the Search & Reporting app by clicking on Edit properties.

You can change the app's display name, whether the app should check for updates, and whether the app should be visible in the Apps panel or not.
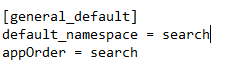
Tip: If you want to land into the Search app upon login automatically, you can do so by editing the user-prefs.conf file.
Windows: C:\Program Files\Splunk\etc\apps\user-prefs\default\user-prefs.conf
Linux: /opt/splunk/etc/apps/user-pref/default/user-prefs.conf
Before:
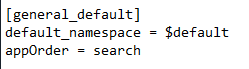
After:
Note: The above paths' base location will be different if you changed your Splunk install location.
Tip: Best practice is for any modifications to Splunk confs, you should create a directory and place custom conf settings there. When Splunk is upgraded the defaults are overwritten. For this room editing the defaults is OK.
In order for the user preferences changes to take effect, the splunkd service has to be restarted from a command-line prompt, using the following two commands: net stop splunkd and net start splunkd.
Lastly, you can install more Splunk apps to the Splunk instance to further expand Splunk's capabilities. You can either click on + Find More Apps in the Apps panel or Splunk Apps in the Explore Splunk panel.
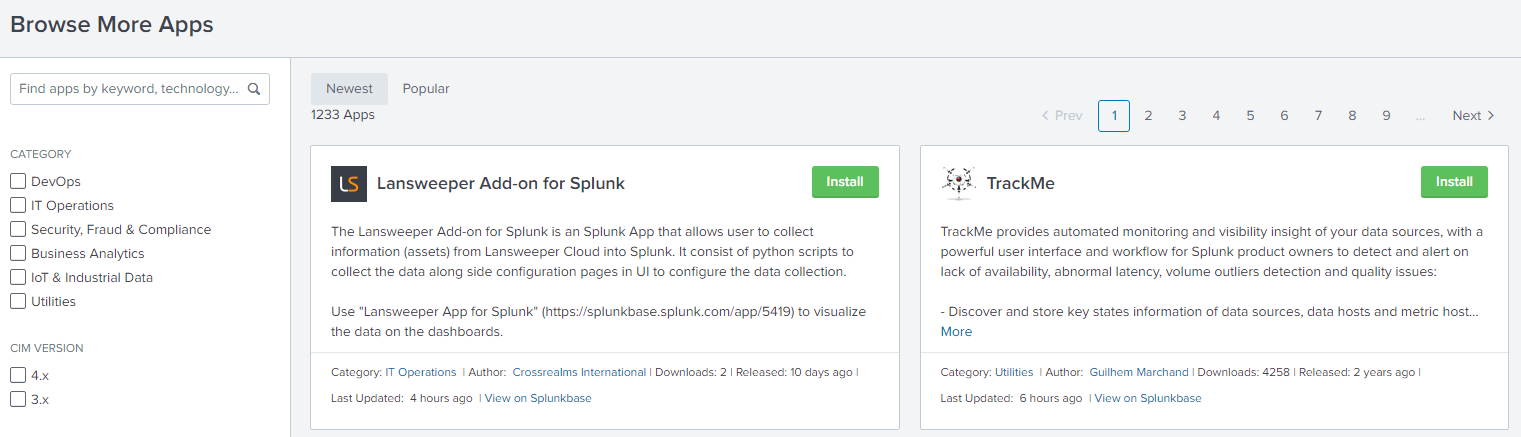
To install apps into the Splunk instance, you can either install directly from within Splunk or download it from Splunkbase and manually upload it to add it to your Splunk instance.
Note: You must have an account on Splunk.com to download and install Splunk apps.
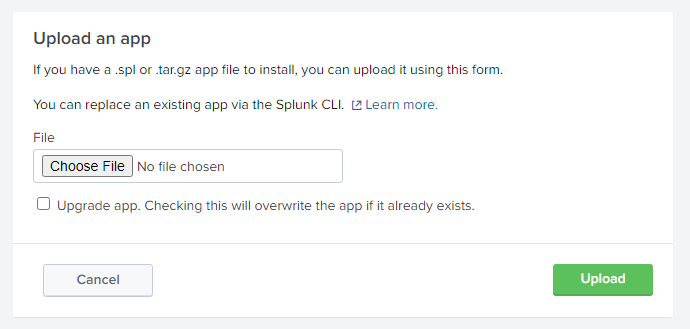
If you wish to install the app manually, click the Install app from file button.
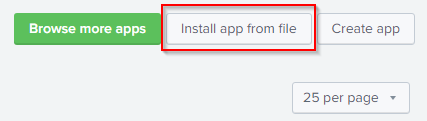
Just browse to the location of the app and upload it.
You can also download the app (tgz file) from Splunkbase. You then unzip the file and place the entire directory into the Apps location for your Splunk instance.
Note: If you performed the install steps from the Linux section within this room and manually copied an App to the Apps location for your Splunk instance, you might need to change the file ownership and group to splunk or else your Splunk instance might not restart properly.
Back to Windows, if you wish to remove an app (or an add-on), you can do so via the command-line.
Below is the command to perform this task on Windows.
C:\Program Files\Splunk\bin>splunk.exe remove app app-name -auth splunk-username:splunk-password
Note: The syntax is similar on Linux machines.
If the command were successful, you would see the following output: App 'app-name' removed
Refer to the following Splunk documentation here for more information about managing Splunk apps.
Now time to upload an add-on into the Splunk instance.
There is a Splunk add-on on the desktop. Upload this add-on into the Splunk instance. Restart Splunk when prompted to.
![[Pasted image 20220906103524.png]]
![[Pasted image 20220906103429.png]] What is the 'Folder name' for the add-on? TA-microsoft-sysmon (after upload .gz)
What is the Version? 10.6.2
Adding Data
Splunk can ingest any data. As per the Splunk documentation, when data is added to Splunk, the data is processed and transformed into a series of individual events.
The sources of the data can be event logs, website logs, firewall logs, etc.
Data sources are grouped into categories. Below is a chart listing from the Splunk documentation detailing each data source category.

Please refer to the Splunk documentation here for more information regarding the specific data source you want to add Splunk.
In this room, we're going to focus on Sysmon Logs.
When we click on the Add Data link (from the Splunk home screen), we're presented with the following screen.

Looking at the guides, if we click on Operating System, we should see Windows event logs. But the only option available is Forward data to Splunk indexers. This is not what we want.
Let's ignore the guides and look at the bottom options: Upload, Monitor, and Forward.
Note: The above screenshot is what you'll see if you installed Splunk locally on your end. The Splunk instance in the attached room will only show Upload, Monitor, and Forward. (see below)
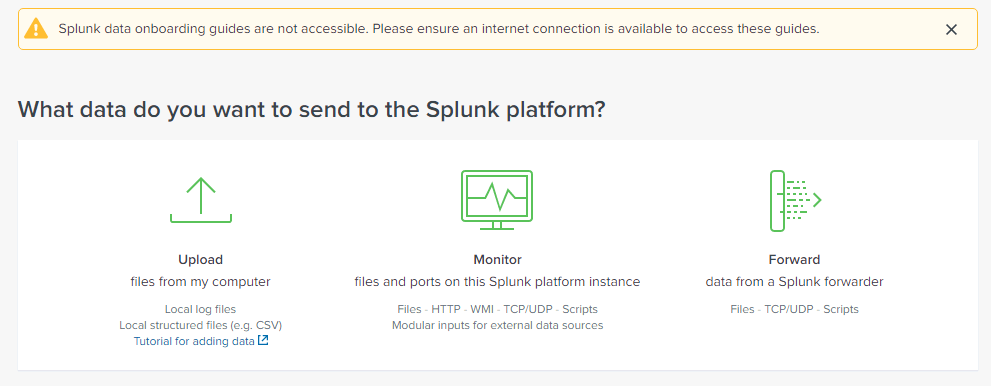
Since we want to look at Windows event logs and Sysmon logs from this host system, we want Monitor.
There are many options to pick from on the following screen. Local Event Logs is the one we want.
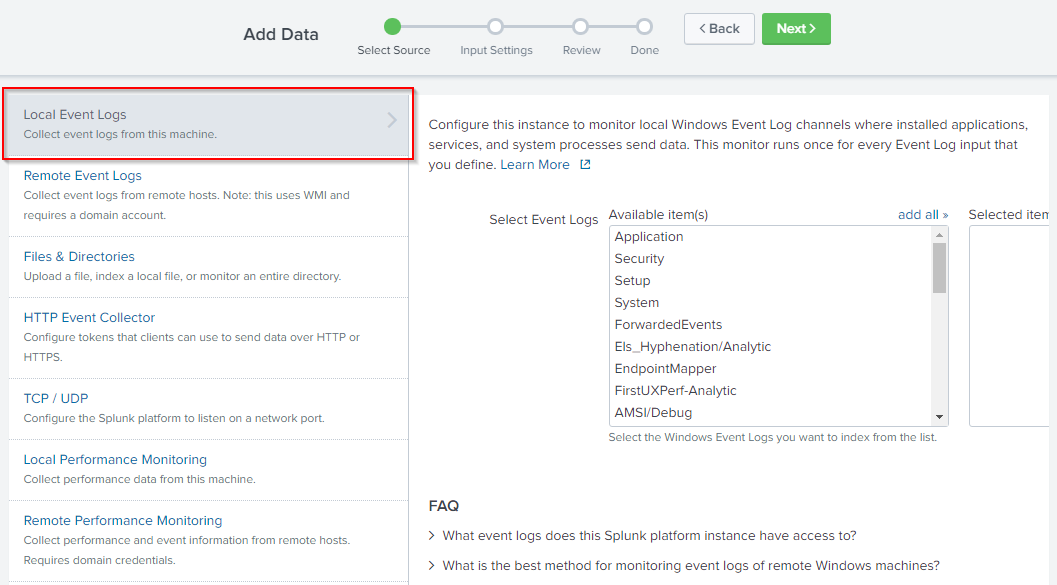
Look at the list of Available item(s). Do you see PowerShell logs listed? How about Sysmon? I didn't either.
Another way we can add data to the Splunk instance is from Settings > Data Inputs.
Upload the Splunk tutorial data on the desktop. How many events are in this source?
Note: Make sure you upload the data once only.
As you can see, there are A LOT more logs we can add to the Splunk instance.
Now it's your turn to add some data to the Splunk instance so we can start querying them.
![[Pasted image 20220906105105.png]]
109,864 (upload tutorial.zip and choose segment value 1 next next and search)
Splunk Queries
By now, you should have installed the Splunk app/add-on and added a data source to Splunk.
Now is the fun part, querying the data that is now residing in Splunk.
If you have completed the Windows Event Log and Sysmon rooms, you can remember that you queried the various logs using either Event Viewer, the command-line, or PowerShell and used filtering techniques to narrow down the information we're looking for.
Thankfully, with a SIEM (such as Splunk), we can create queries to find the data we're looking for across various data sources in one tool.
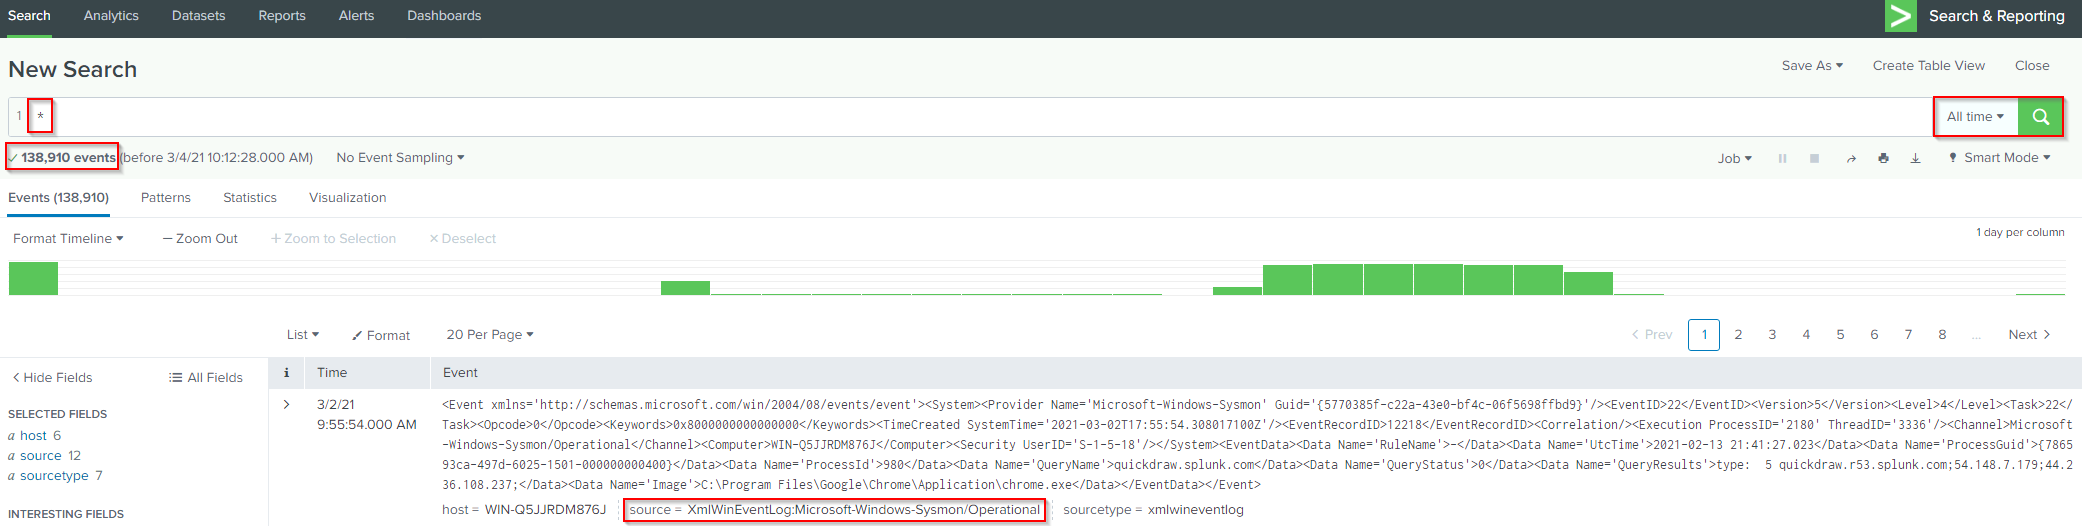
Enter an asterisk * in the Search bar and change the timeframe to search from Last 24 hours to All time. This will retrieve all the historical data within Splunk.
Even though we haven't discussed Filters yet but essentially Last 24 hours and All time are filters. We're instructing Splunk to output all the events from the historical data within the last 24 hours from the point in time we submit our query.
Click on the magnifying glass to initiate the search.
Note: The output you see might be different for you.
If you want to focus on a specific source or sourcetype, you can specify that within the Search bar. (see below image)
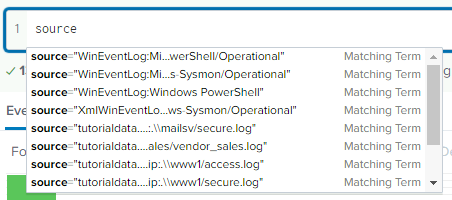
This information is also available if you click on source or sourcetype under Selected Fields.
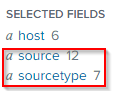
Let's look at source.
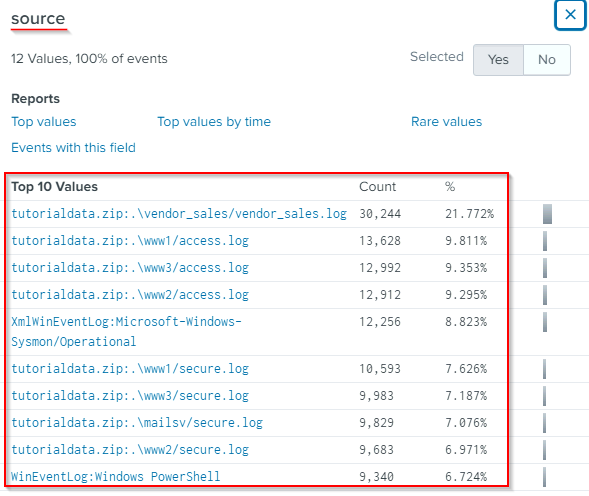
From the above image, we see the names (values) of each source and the number of events (count), and the percentage value (%) of all the events for each source.
In the above image, the top 10 values are visible.
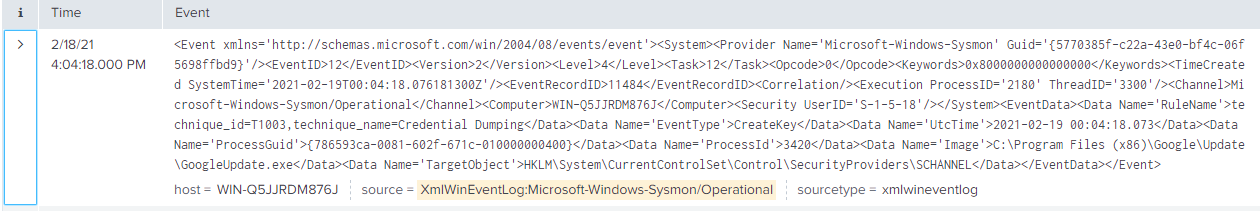
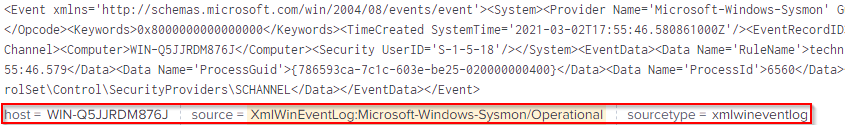
Let's start our query with Sysmon as the source. The query will look like this:
source="XmlWinEventLog:Microsoft-Windows-Sysmon/Operational"
We'll use this one, instead of WinEventLog:Microsoft-Windows-Sysmon/Operational, since it has more events we can sift through.
I'll select the first event that appeared for me for demonstration purposes. Expanding on the event, the details of the event are more readable.
Before:
After:
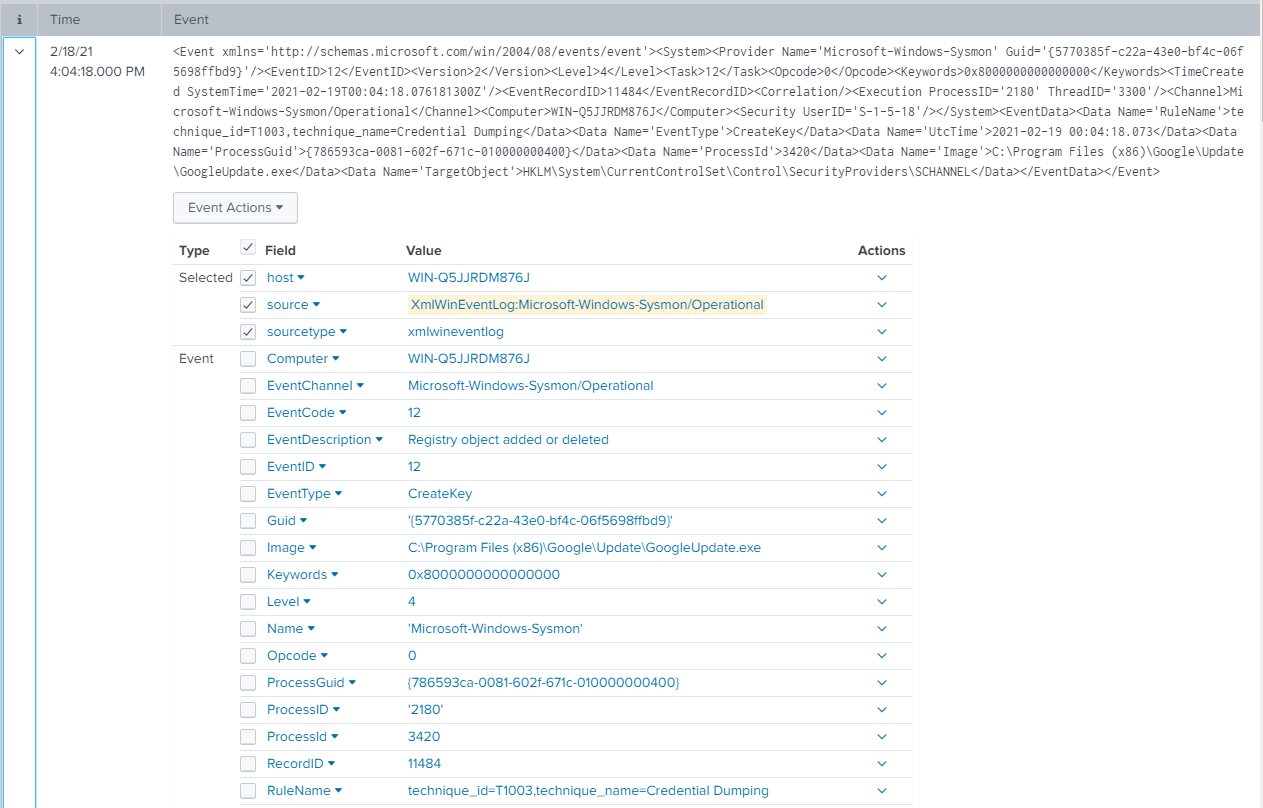
Some of these fields are specific to Sysmon. Refer to the Sysmon room if you are not familiar with Sysmon Event IDs.
Note: The fields will be different depending on the source/sourcetype.
Back to our query, we can adjust our query to show events with Event ID 12, RegistryEvent (Object create and delete).
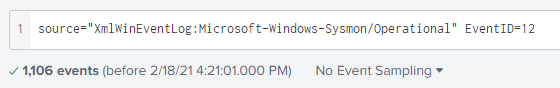
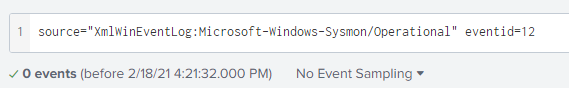
Fields are case-sensitive. If you attempt to query for EventID in all lowercase, no results will be returned.
You can also search by keywords. Using the same event from above, I'll adjust the query and manually enter 'GoogleUpdate.exe.'
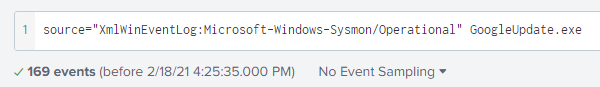
Unlike fields, keywords are not case-sensitive.
Instead of manually keying in the keyword, the keyword can also be added by clicking the value you would like to add to the existing query (Add to search) or start a new query (New search).
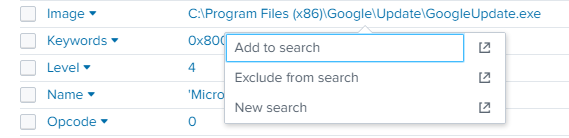
In the above image, I clicked on 'GoogleUpdate.exe,' and the options appeared.
Note: If you click on the icon to the far right for each choice, it will open the query in a new window.
In the example below, I selected to Add to search.

You can use multiple keywords in your query. Splunk will use an implicit AND operator between each keyword.
Example: * GoogleUpdate.exe chrome_installer.exe
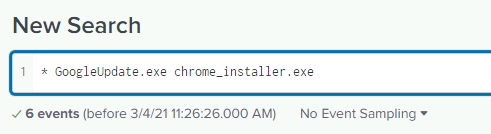
Note: You can try this query in the THM Splunk instance.
The above query will search across all the events (according to the timeframe specified) and return all the events with GoogleUpdate.exe AND chrome_installer.exe.
A keyword doesn't have to be a 'word' necessarily, but it can be a phrase.
To search for a phrase, you need to surround the phrase with quotes. See the example below.
Example: * "failed password for sneezy"
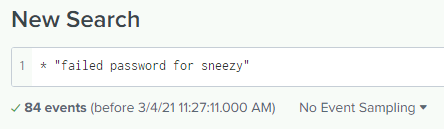
The above query will return any events that contain the exact phrase.
Note: You can try this query in the THM Splunk instance. (Make sure you imported tutorialdata.zip into the Splunk instance first)
Moving along. Let's go back to the Sysmon logs and look at GoogleUpdate.exe again.
Draw your attention to the Interesting Fields sidebar. This information is useful and can help adjust your query and narrow down your search results even more.
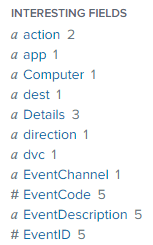
Let's look at RuleName and see what the 8 values are.
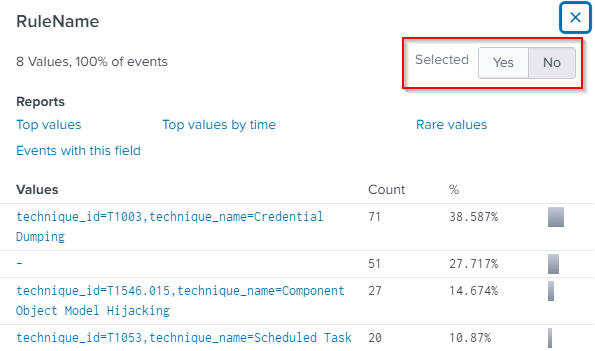
We can further expand on our query with one of these values.
Note: If you click on any of the Interesting Fields sidebar values, it will be automatically added to the existing query.
Another thing to note regarding Interesting Fields. Let's say we would like to see the RuleName appear for each event, just like the host, source, and sourcetype fields (the default fields for every event).
You can change the value of Selected from No to Yes. This is visible in the above image. The value in the image is set to No.
Let's change the value of Selected to Yes for RuleName.
Before:
After:
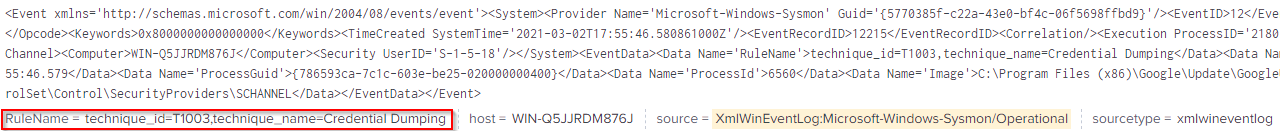
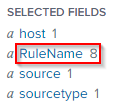
The Selected Fields sidebar reflects the change.
Refer to the following Splunk documentation for more information on searching in Splunk.
https://docs.splunk.com/Documentation/Splunk/8.1.2/SearchTutorial/Aboutthesearchapp
https://docs.splunk.com/Documentation/Splunk/8.1.2/SearchTutorial/Startsearching
https://docs.splunk.com/Documentation/Splunk/8.1.2/SearchTutorial/Aboutthetimerangepicker
https://docs.splunk.com/Documentation/Splunk/8.1.2/SearchTutorial/Usefieldstosearch
https://docs.splunk.com/Documentation/Splunk/8.1.2/SearchTutorial/Usefieldlookups
https://docs.splunk.com/Documentation/Splunk/8.1.2/SearchTutorial/Searchwithfieldlookups
https://docs.splunk.com/Documentation/Splunk/8.1.2/Knowledge/AboutSplunkregularexpressions
Note: Some of the information in the above links will overlap each other.
The Splunk Quick Reference Guide has more tips on searching and filtering in Splunk, along with other tips.
In the next section, we'll look at tools that can help us create Splunk queries to search specific attack patterns.
![[Pasted image 20220906111952.png]]
Use Splunk to Search for the phrase 'failed password' using tutorialdata.zip as the source. No answer needed What is the sourcetype? www1/secure
In the search result, look at the Patterns tab. No answer needed
What is the last username in this tab? myuan
![[Pasted image 20220906112111.png]] Search for failed password events for this specific username. How many events are returned? 16 (in my case 32 cz upload 2 times)
Sigma Rules
Florian Roth created Sigma.
What is Sigma?
As per the GitHub repo, "Sigma is a generic and open signature format that allows you to describe relevant log events in a straightforward manner. The rule format is very flexible, easy to write and applicable to any type of log file. The main purpose of this project is to provide a structured form in which researchers or analysts can describe their once developed detection methods and make them shareable with others."
Each SIEM has its own structure/format for creating queries. It isn't easy to share SIEM queries with other Security Teams if they don't use your exact SIEM product. For example, you can have a repo of Splunk queries that your team utilizes for threat exposure checks or threat hunting. These queries (or rules) can be created in the Sigma format and shared with teams that don't use Splunk. Sigma rules can be shared along with IOCs and YARA rules as Threat Intelligence.
Some supported target SIEMs:
[Splunk](https://www.splunk.com/)
[Microsoft Defender Advanced Threat Protection](https://www.microsoft.com/en-us/security/business/endpoint-security/microsoft-defender-endpoint)
[Azure Sentinel](https://azure.microsoft.com/en-us/services/microsoft-sentinel/)
[ArcSight](https://www.microfocus.com/en-us/cyberres/secops/arcsight-esm)
[QRadar](https://www.ibm.com/products/qradar-siem)
Some projects/products that use Sigma:
[MISP](https://www.misp-project.org/index.html)
[THOR](https://www.nextron-systems.com/thor/)
[Joe Sandbox](https://www.joesecurity.org/)
There also is a Splunk app titled TA-Sigma-Searches.
Sigma rules are written in YAML (YAML Ain't Markup Language).
As per the website, "YAML is a human friendly data serialization standard for all programming languages."
The Sigma repo has signatures in the rules folder. Sigmac, the Sigma Converter, located in the tools folder, can generate a specific SIEM rule.
Example: ./sigmac -t splunk -c tools/config/generic/sysmon.yml ./rules/windows/process_creation/win_susp_whoami.yml
Please refer to the Github repo for more information, examples, install instructions, rules, etc.
An online version of this tool created by SOC PRIME (Florian Roth) does the conversion work for you. The tool is Uncoder.io.
This online tool is not only for Sigma -> SIEM conversion. It also allows for other conversions. I'll leave you to explore that.
Let's explore this online tool a bit.
Near the top, there is a drop-down box. This drop-down will feature Sigma rules we can convert to a Splunk query.
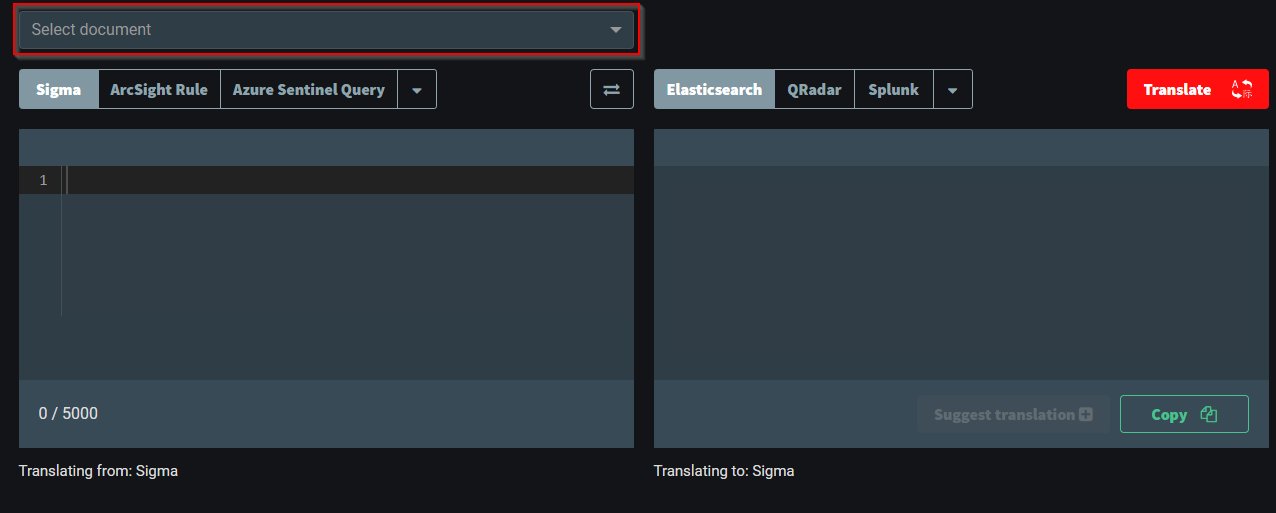
Choose some Sigma rules and convert them to Elasticsearch, QRadar, Splunk, etc.
The Sigma rule for 'User Added to Local Administrators' is converted to a Splunk query in the example below.
The best way to get familiar and comfortable with Sigma and YAML files is to inspect that repo and look at Sigma rules and create some of your own.
![[Pasted image 20220906113235.png]]
Use the Select document feature. What is the Splunk query for 'sigma: APT29'?
CommandLine="*-noni -ep bypass $*"
![[Pasted image 20220906113706.png]]
![[Pasted image 20220906113639.png]]
Use the Github Sigma repo. What is the Splunk query for 'CACTUSTORCH Remote Thread Creation'?
source="WinEventLog:*" AND ((SourceImage="*\\System32\\cscript.exe" OR SourceImage="*\\System32\\wscript.exe" OR SourceImage="*\\System32\\mshta.exe" OR SourceImage="*\\winword.exe" OR SourceImage="*\\excel.exe") AND TargetImage="*\\SysWOW64\\*" AND NOT StartModule="*")
Dashboards & Visualizations
Dashboards are panels displaying different data (visualizations) in one view.
Visualizations allow us to view data in a visual format, such as a chart (bar or pie, for instance) or as a single value.
Typically SOCs create a variety of dashboards, and these dashboards are displayed on large screens. Different dashboards can be created, but the dashboards' overall objective is to provide a high-level overview of the environment.
Circling back to the Windows Event Log room, it was briefly mentioned that in Event Viewer, we could useCreate Custom View . A custom view is a filter to focus on specific data within the log. This concept is similar to a dashboard in a SIEM.
Note: Dashboards are specific to Apps. If you create a dashboard for the Search app, then the dashboard uses this particular app's context.
Follow these steps to create a dashboard in the Search app (and enable dark mode).
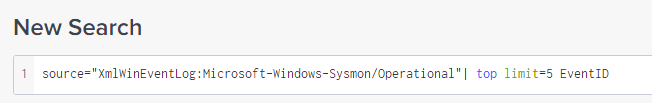
We're tasked to display the top 5 Sysmon Event IDs on the dashboard for the SOC team.
First, we'll create the search query, pipe to a transform command to filter the top 5 Event IDs, and examine the results.
After we confirm the query and results, we can look at Visualizations.
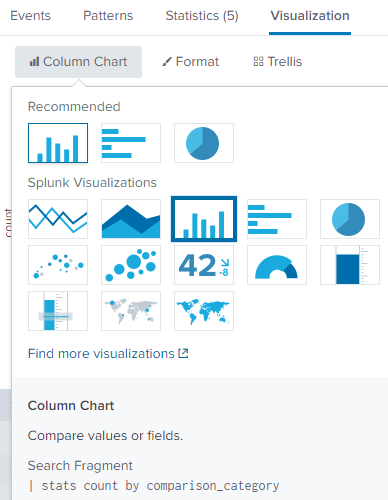
Please refer to the Splunk documentation on Dashboards and Visualizations to understand the difference between each option here.
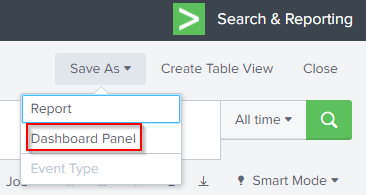
After the visualization is selected, save it as a Dashboard panel.
If the dashboard is already created, we can select Existing for Dashboard and select it.
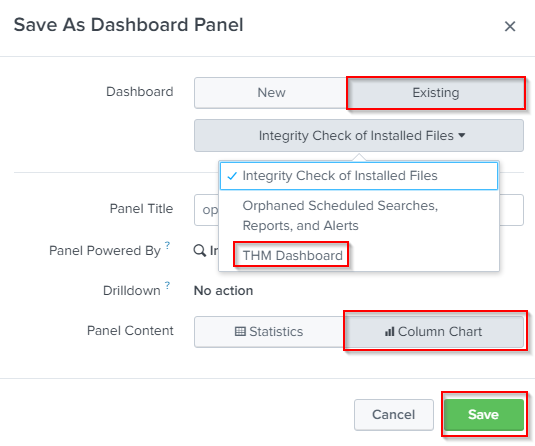
After successfully saving the Dashboard Panel, you can view the dashboard.
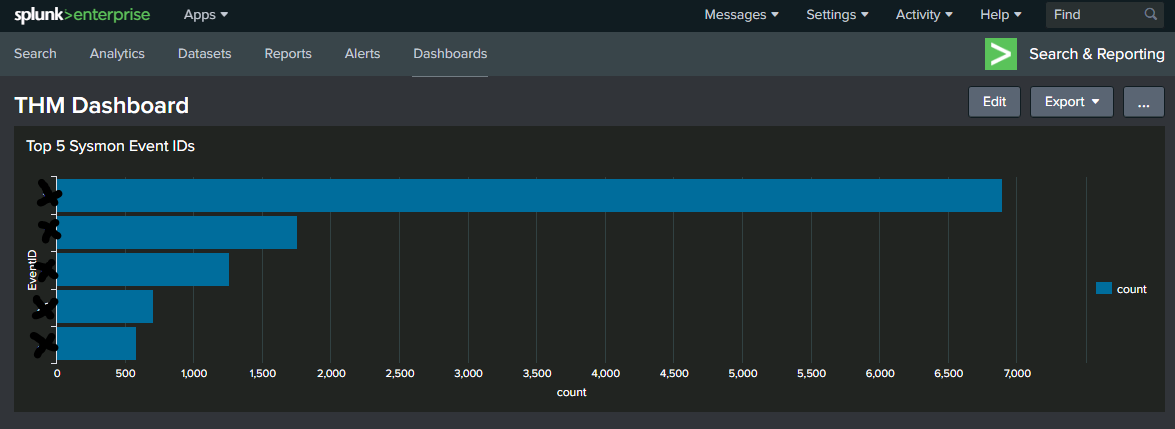
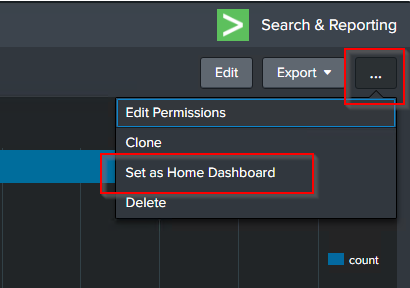
If you wish to add the dashboard to your home page, you can click on the ellipsis and select the option.
Result:
Note:
Refer to the Splunk documentation on dashboards and visualizations:
https://docs.splunk.com/Documentation/Splunk/8.1.2/Viz/WebFramework
https://docs.splunk.com/Documentation/Splunk/8.1.2/Viz/Aboutthismanual
https://docs.splunk.com/Documentation/Splunk/8.1.2/Viz/CreateDashboards
https://docs.splunk.com/Documentation/Splunk/8.1.2/Viz/AddPanels
https://docs.splunk.com/Documentation/Splunk/8.1.2/SearchTutorial/Createnewdashboard
In the next section, we'll briefly touch on alerts in Splunk.
![[Pasted image 20220906115058.png]] What is the highest EventID? 11
Alerts
Alerts is a feature in Splunk that enables us to monitor and respond to specific events.
Alerts use a saved search to monitor events in real-time or on a schedule. Alerts will trigger when a specific condition is met to take the defined course of action.
Let's look at 'The alerting workflow' from the Splunk documentation.
Search: What do you want to track?
There is an external IP brute-forcing a web page. We want to be alerted whenever this IP address is actively attacking the infrastructure.
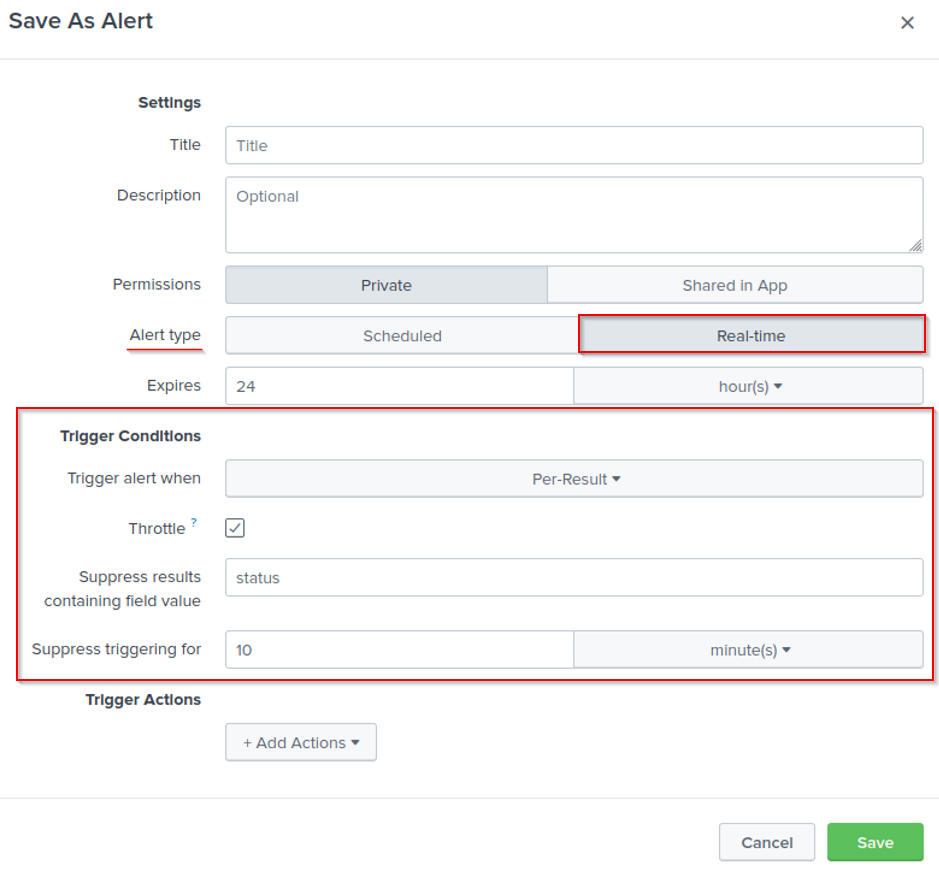
Alert Type: How often do you want to check for events?
Since we want to be alerted whenever this IP is active, a real-time alert is what we'll configure.
Alert trigger conditions and throttling: How often do you want to trigger an alert?
If 10 failed password events under 1 minute, generate an alert.
Alert action: What happens when the alert triggers?
Send an email or send a message in an application using a [webhook](https://docs.splunk.com/Documentation/Splunk/8.1.2/Alert/Webhooks).
In Splunk Free, we can not create alerts. You can experiment with this feature in the 60-day trial of Splunk Enterprise.
Please reference the Splunk documentation on Alerting here to fully understand the different ways to configure them.
Here is the direct link to Alert examples.
I have a general understanding on how to create an alert in Splunk. No answer needed
Conclusion
There is more to Splunk than what was covered in this 101 room.
Besides developing a good understanding of SPL (Search Process Language), it would be a good idea to level up your regex-fu. This will increase your ability to write complex search queries. Read more about regular expression in the Splunk documentation here.
Splunk has a free training + certification titled Splunk Fundamentals 1. This course will cover much that was covered in this room and more.
When you're ready for more advanced Splunk, head over to the Splunk BOTSv1 and BOTSv2 rooms.
I know the fundamentals of Splunk. No answer needed
[[Osquery]]